> For the complete documentation index, see [llms.txt](https://help.movin3d.com/llms.txt). Markdown versions of documentation pages are available by appending `.md` to page URLs; this page is available as [Markdown](https://help.movin3d.com/movin-tracin-stage/setup/the-workspace.md).
# The workspace screen
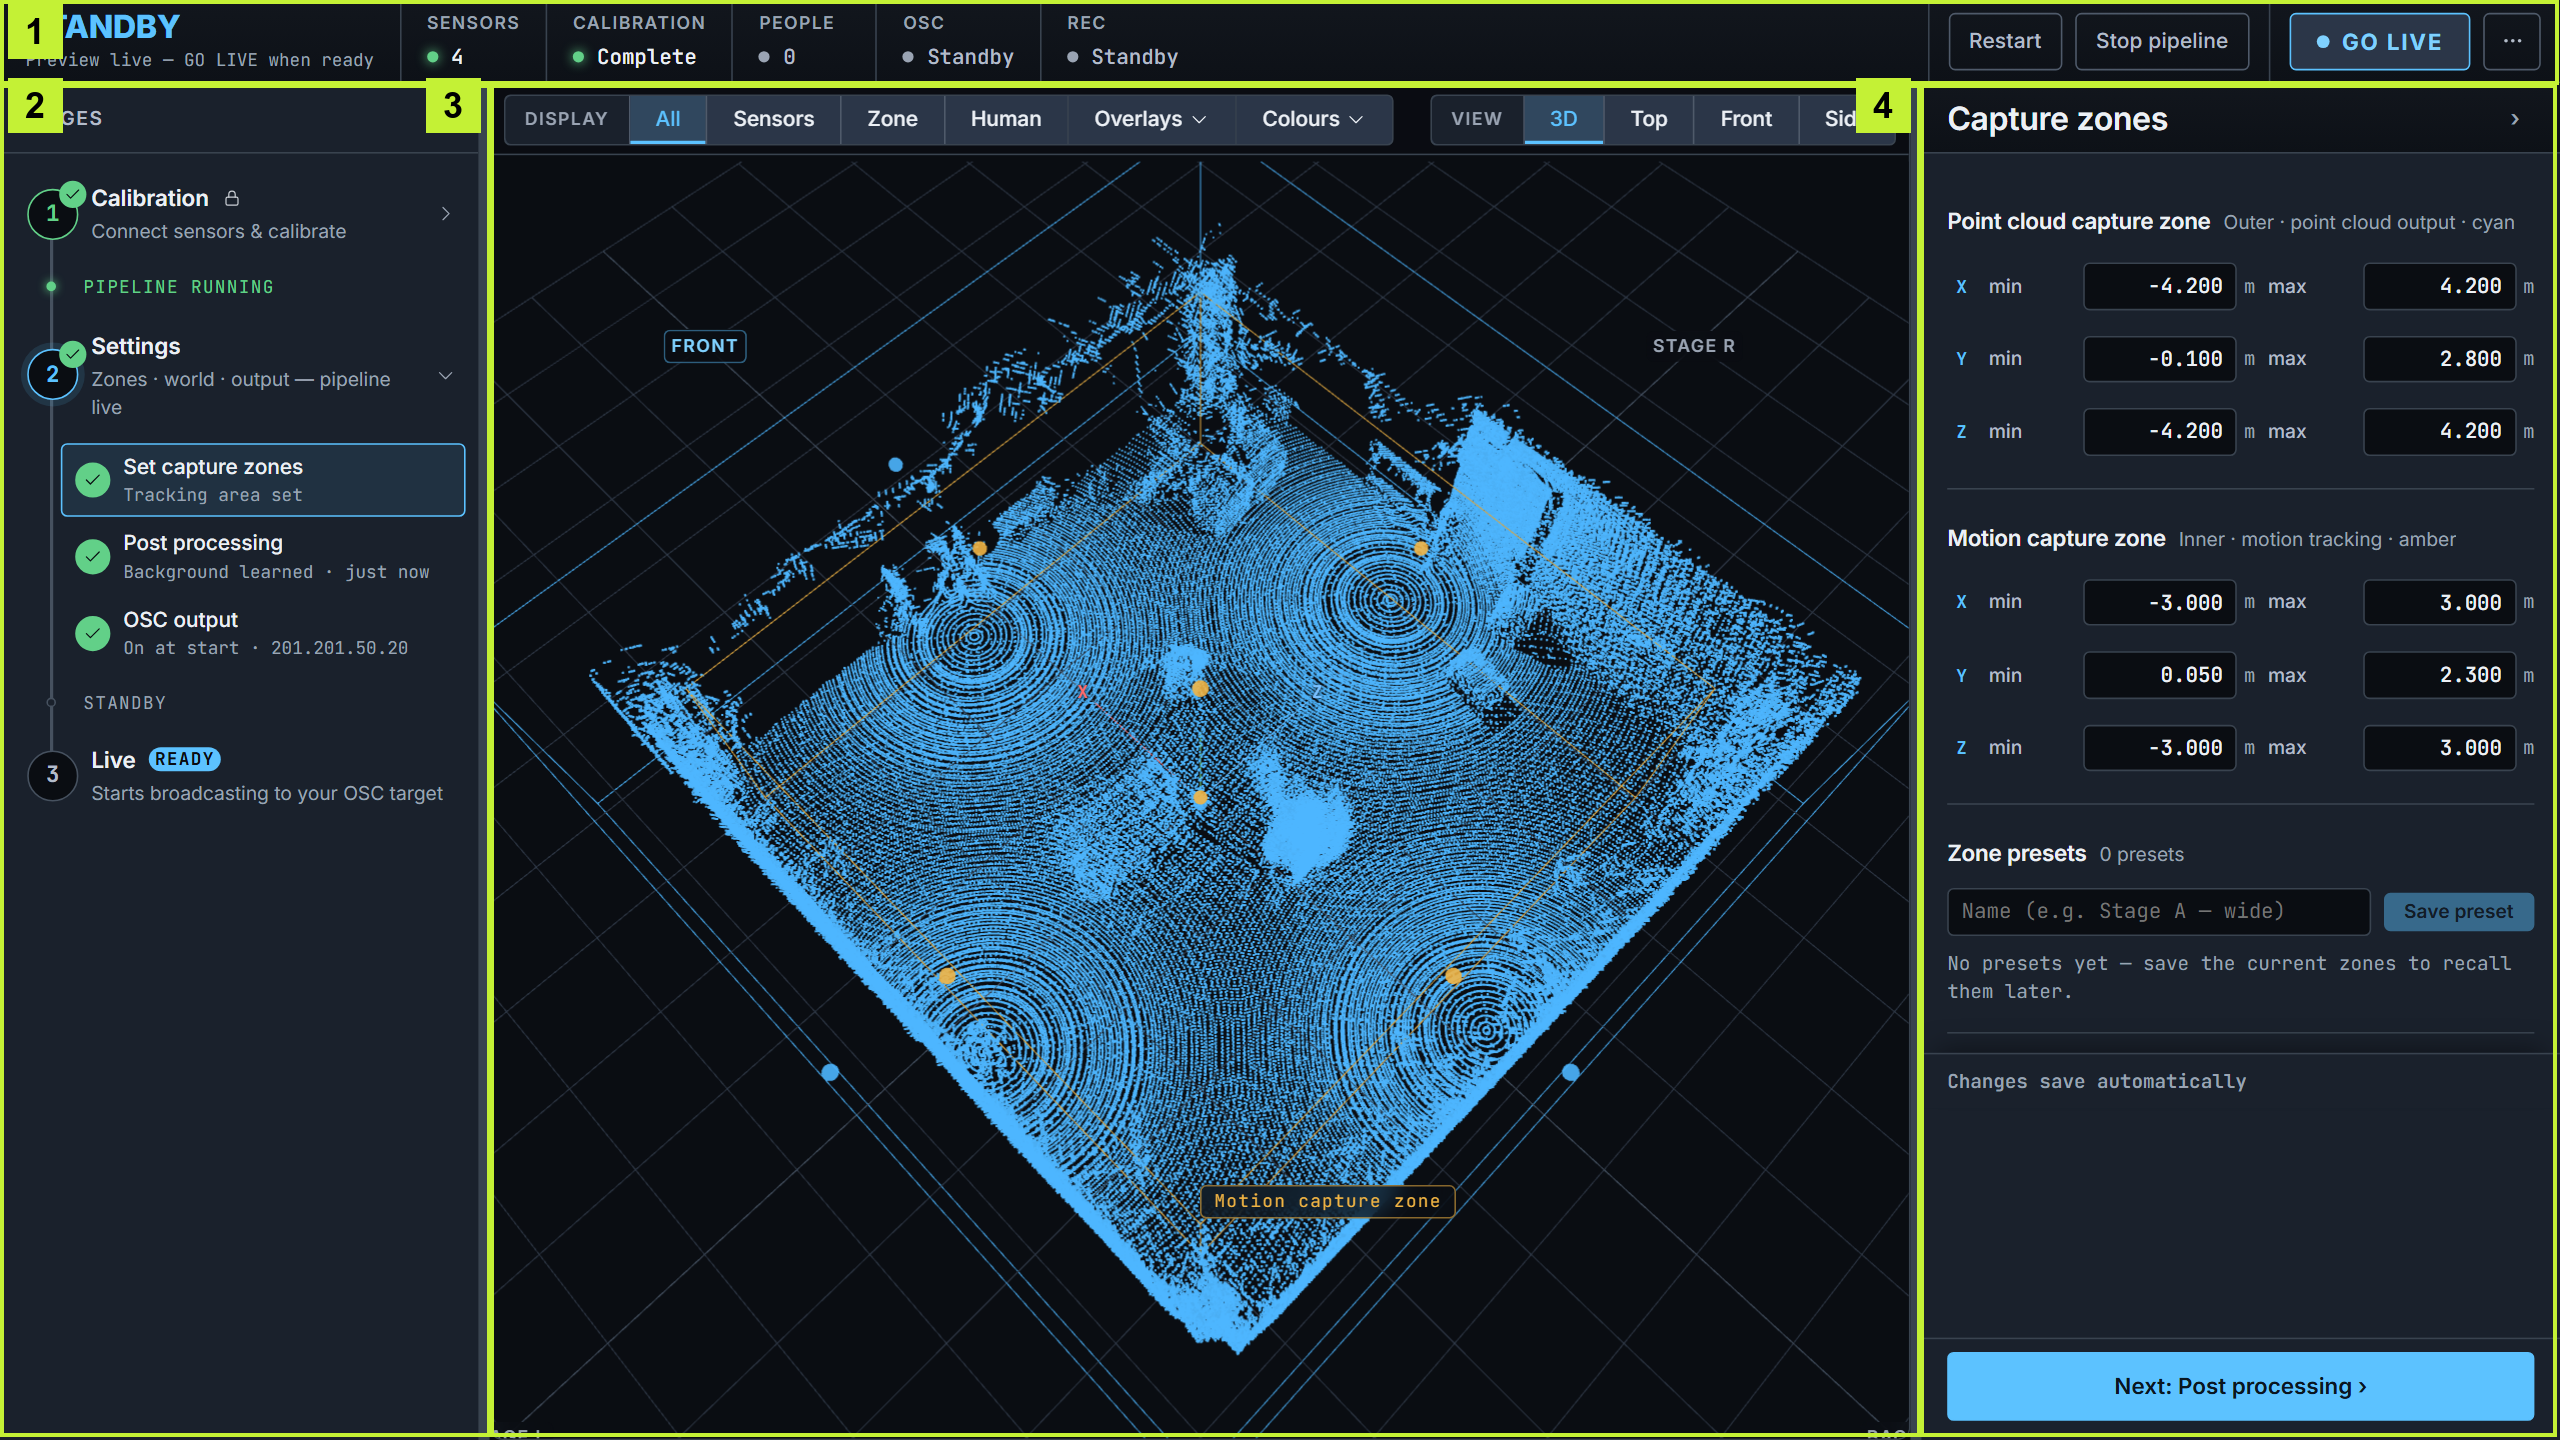
A tour of the workspace screen: the top bar with system status, stage navigation, the 3D viewport, and the inspector panel on the right.
The workspace opens automatically on the monitor connected to the server when you turn it on. If it is not open yet, follow [Connect and power on](/movin-tracin-stage/install-the-hardware/server-back.md).
For your first setup, find **Calibration** on the left and follow its **NEXT** step. The center shows the scene; the right panel contains controls for the selected step.
The four areas: 1 the top bar, 2 stage navigation, 3 the viewport, and 4 the inspector.
The screenshot shows **Settings with preview running**. On first boot, the cloud and the completion marks may not appear yet.
## 1 · Top bar — system status
**System status** — the current state, as a single word. The line below names the next thing to fix, or shows the elapsed time once the show is live.
* **SETUP** — setup is incomplete.
* **READY** — ready to start.
* **STANDBY** — previewing live data; nothing is broadcast.
* **LIVE** — broadcasting.
* **FAULT** — a problem needs attention.
**Status indicators** — hover over one for details.
* **Sensors** — how many are detected. Becomes `4/5` if one stops sending during a show.
* **Calibration** — Complete or None.
* **People** — how many people are tracked right now.
* **OSC** — **Live** with the destination, or **Standby**.
* **Rec** — an elapsed clock while recording.
* **LTC** — appears only while an external timecode source is locked.
**Controls** — **GO LIVE** starts broadcasting and becomes **END LIVE** while on air. **Restart** and **Stop pipeline** appear while the pipeline is running. The **⋯** menu holds the server controls and **Show welcome**.
There is no separate start button — opening the **Settings** stage starts the system in preview.
## 2 · Stage navigation (left)
Complete the three stages in order: **Calibration**, **Settings**, and **Live**.
* A completed stage shows a check mark. Calibration and Settings expand to show their sub-steps.
* A **NEXT** tag marks the next required step.
* A locked stage isn't available yet — hover over it to see why. **Calibration locks** once the pipeline is running and shows a 🔒 icon.
## 3 · Viewport (center)
The live 3D point cloud, with the capture zones drawn over it.
The **Display** control picks which point cloud is drawn — **All**, **Sensors**, **Zone**, or **Human** — and holds two drawers: **Overlays** shows or hides the point cloud, each capture zone, and the mocap skeletons, and **Colors** names which color belongs to which sensor and which zone. Display only changes what you see — never what the show receives.
Voxelization shows on **Zone** and **Human** only, and background removal on **Human** only. If the cloud looks unfiltered, check this control before changing the filters.
If a sensor stops sending during a show, an alert appears in the viewport — see [If a sensor drops out mid-show](/movin-tracin-stage/running-a-show/running-a-show.md#if-a-sensor-drops-out-mid-show).
## 4 · Inspector (right)
A context panel that displays the controls and details for the selected item — a stage guide, the sensor list, the zones, the OSC output, and so on.
## First launch
The first time you open the workspace, a welcome screen explains what the app does. Select **Got it** to dismiss it, then begin from the **Calibration** stage on the left. You can reopen it any time from the **⋯** menu → **Show welcome**.
Continue to [Stage 1 · Calibration](/movin-tracin-stage/setup/calibration.md).
---
# Agent Instructions
This documentation is published with GitBook. GitBook is the documentation platform designed so that both humans and AI agents can read, navigate, and reason over technical content effectively. Learn more at gitbook.com.
## Querying This Documentation
If you need additional information that is not directly available in this page, you can query the documentation dynamically by asking a question.
Perform an HTTP GET request on the current page URL with the `ask` query parameter, and the optional `goal` query parameter:
```
GET https://help.movin3d.com/movin-tracin-stage/setup/the-workspace.md?ask=&goal=
```
`ask` is the immediate question: it should be specific, self-contained, and written in natural language.
`goal` is optional and describes the broader end goal you are ultimately trying to accomplish on behalf of the user. GitBook uses it to tailor the answer towards what is most useful for that goal.
The response will contain a direct answer to the question and relevant excerpts and sources from the documentation.
Use this mechanism when the answer is not explicitly present in the current page, you need clarification or additional context, or you want to retrieve related documentation sections.